USA: Where has the land gone?
By Markus Wolf, DLG Mitteilungen
The battle for acreage is waged every spring in the USA. In this arms-length dispute, the basic issue is whether to seed corn or soybeans as a summer crop. Spring wheat plays a minor role with less than 5 million hectares. If there is a shift in acreage, the question that moves the market is: to what extent does one crop take land away from the other?
The answer to this question regularly leads to major price corrections.
These occur both upward and downward. This was most recently the case at the end of June, when updated U.S. Department of Agriculture (USDA) acreage data for both crops fell well short of market expectations (by 450,000 acres for corn and 600,000 acres for soybeans) despite upward revisions. Overall, farmers expanded sowings of the three most important arable crops in terms of area (corn, soybean and wheat) by 3.6 million ha year-on-year to almost 92 million ha.
For other arable crops, too, the authority assumes an increase in area - but in many cases also a decrease. The bottom line is that the main crops increased by 2 million hectares to 128 million hectares. However, this increase does not change the fact that the sowing of main crops is still a long way from the 132 million hectares recorded in 2014.
Arable land in the USA has been shrinking for several years.
From 1998 to 2014, cropland moved in a narrow range around the mean of 145.5 million ha, but an unexpected downward trend began with the 2014 sowing season. By 2020, U.S. cropland area had declined by 6.5 million ha. Scott Irwin of the Department of Agricultural and Consumer Economics at the University of Illinois points out.
The downturn is all the more surprising, he says, because U.S. cropland - that is, main crops + prevented seeding + Conservation Reserve Program (CRP) land - was just about locked in, especially during the ethanol boom years between 2007 and 2013. So what's behind the acreage loss?
For one thing, different data collection methodologies and measurement errors certainly play a role. But it is unlikely that their influence has grown over the years. Looking at the years leading up to 2014, Irwin concludes that the land committed to the CRP program served as a kind of land buffer: When farm prices were low, farmland was taken into the CRP; when prices were high, farmland was taken out of the CRP.
Since 2013, this explanation no longer holds, as both cropland (- 5.3 million ha) and CRP area (- 2 million ha) shrank by 2020. USDA data suggest that about 80% of the land taken out of the CRP has returned to cropland.
This means that since 2014, U.S. farmers have brought an estimated 1.6 million ha of former CRP land back into cultivation, and yet the area of major crops shrank so much that the bottom line is a gap of several million ha.
The acreage data is surprising
According to the U.S. Department of Agriculture (USDA) at the end of June, 2021 corn plantings exceed last year's acreage by 2% at 37.5 million acres. Soybean seeding is up 5% year-over-year to 35.5 million ha. Significantly larger expansions had been expected on the futures market. Prices for corn and soybeans reacted accordingly with sharp price jumps following publication of the new area report. Despite an increase of 5%, U.S. wheat cultivation remains at a low level. The 18.9 million ha reported by USDA is the fourth lowest since records began in 1919, with winter wheat area exceeding expectations by about 0.3 million ha at 13.6 million ha.
Based on the updated area data, USDA also revised its domestic crop forecasts in mid-July. Compared to the previous month, U.S. analysts raised their assumption for harvested area for corn by 0.4 million to just over 34.2 million ha. Record yields of 11.3 t/ha, the harvest potential is thus in the range of the record figure of 385 million t achieved in 2016/17. Domestic consumption is also estimated to be in the range of the previous peak at just over 313 million tons. There were no changes in soybeans from the previous month. The USDA had already adjusted its acreage forecast in advance and also left the assumptions for yields and consumption unchanged. With a U.S. crop of 120 million tons and stocks available at the start of the season, the U.S. will have almost 124 million tons of soybeans available in 2021/22 (previous year: 127 million tons). Subtracting domestic demand and (declining) exports, there is nothing left to replenish depleted stocks. Under these conditions, the soybean market remains vulnerable to crop shortfalls.
In which states is acreage going out of production?
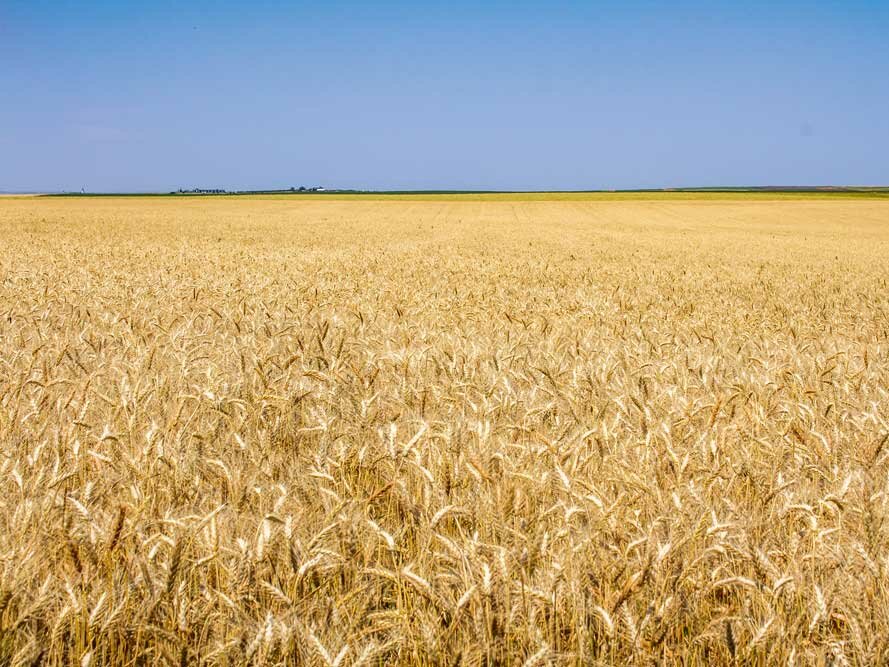
Broken down by region, Irwin identified a decline in total cropland area (major crops + prevented seeding + CRP) between 2014 and 2020 in 46 of the 50 states. Emphatically, the states with the largest declines are in the Great Plains, which run north to south through the middle of the United States.
The states with the most cropland taken out of production during the calculation period are North and South Dakota, Texas, Oklahoma, and Montana. Among the affected crops, wheat is by far the most affected (across all states - 2.4 million acres), followed by hay, which is one of the major crops (- 1.5 million acres), and corn (- 0.7 million acres). For soybeans, only - 120,000 ha are under cultivation.
It is not known whether and how these areas are farmed today. It is likely that a larger proportion lies fallow due to drought or is used as pasture.
Conclusion
What is clear, however, is that the "disappeared land" forms a hidden reserve that can be brought back into production if needed. If prices remain high, we will see further acreage expansions in corn and soybeans in the U.S. next year.


